Is Jmeter capable of doing Performance testing of an application
with Selenium Scripts..?
Answer is yes, this is possible with Jmeter and Selenium
Scripts written over in Junit.
- Jmeter is having set of samplers of doing Different operations. For Integration we have sampler Known as "Junit Request", this can be used to execute tests written in Junit 3 or junit4 (Selenium)
- A test Script written junit4 uses Junit annotations, below is the example of the Scripts which is written in Selenium Junit 4
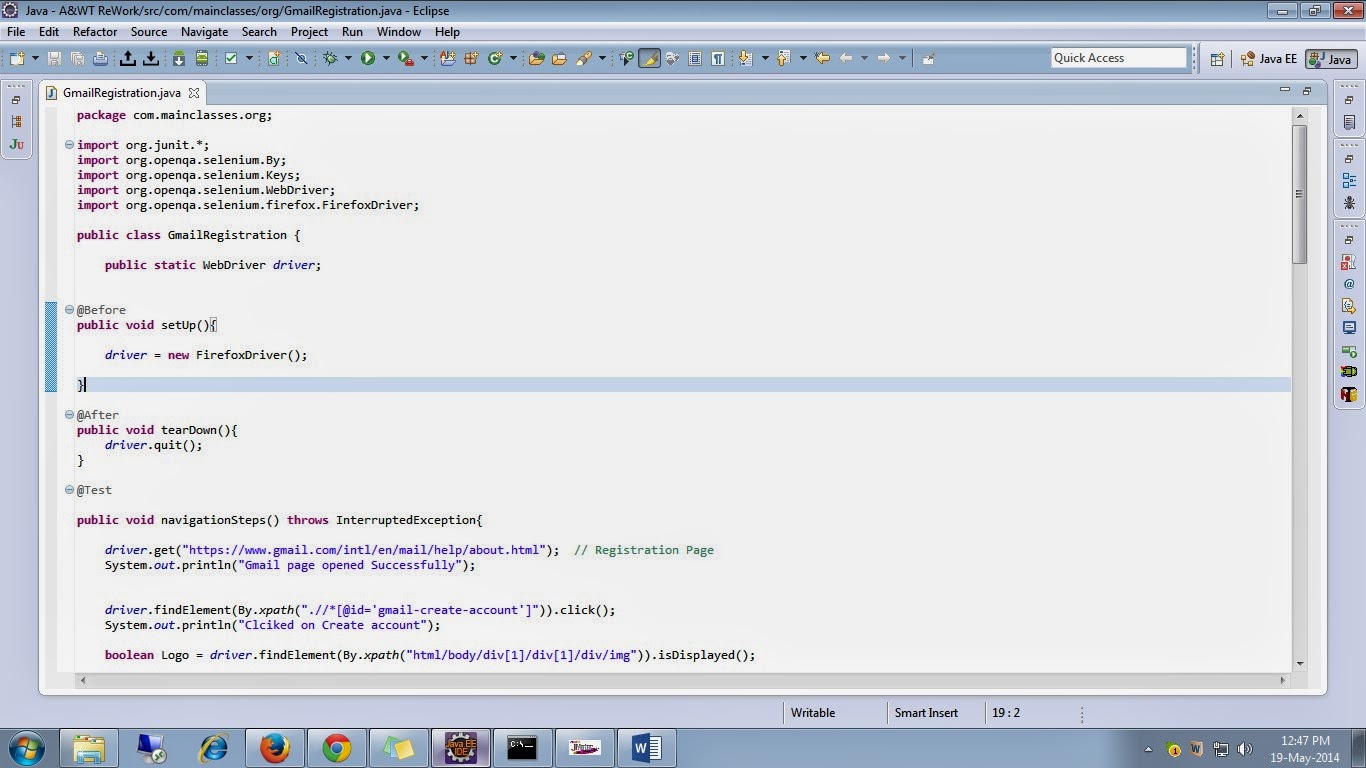
For Total Script click on this Link....... Selenium_JunitScript
Once the Scripting is done , Export them as jar files .To
export to jar files right click on the project folder -> select Export->
Expand Java folder -> Click on Jar files -> Click next -> select the
resources to export -> check the option “Export java source files and
resources”-> Choose destination -> finish

Copy the Jar file and paste it in the Junit folder under lib
folder of Jmeter. Here is the path in my system “D:\apache-jmeter-2.9\lib\Junit”.
Before proceeding further, Download Selenium Standalone
Server at this location “https://code.google.com/p/selenium/downloads/detail?name=selenium-server-standalone-2.39.0.jar”
- Copy the Selenium Standalone server jar file to the lib folder of Jmeter
- Now open Jmeter, Create a Thread group{right click on testplan-> Select ADD-> Select Thread(users)-> Select Thread Group}
- Create a "junit Request"{Right click on Thread Group-> Select Add-> Select Sampler-> Select Junit Request}

In
the two drop downs (Marked as red) one could be the tests that are created
using Junit4 i.e. by extending the Test Case class (Classname)
-
In order to see the tests that are created using
Junit annotations, just check the check box “Search for Junit4 annotations” and
drop downs would populated accordingly
-
Add the listeners to see the results{Right click
on Thread group->Select Add-> Select Listener}
-
Select the test method we want to execute from
the “Test Method” drop down and run the test(press Ctrl+R)
-
It will launch the browser and perform the
actions as per the test scripts.
-
And finally we can view the results in the listeners.
“View result tree in Table” and standard Deviation, Throughput, Mean, Average,
Minimum and Maximum time that the samples took to execute could be noted from
the “Summary/ Aggregate” reports.
The results are looks like below......... :)
